I would like to put here some notes about the thermometers in OpenWrt and Turris.
Turris internal thermometers
Turris has it's own thermometers which are monitoring the temperature of CPU and board. The how-to expects the previous lighttpd configuration described in my previous post. Here is the way how you can create graps wrom the data using RRDtool.
This file contains hidden or bidirectional Unicode text that may be interpreted or compiled differently than what appears below. To review, open the file in an editor that reveals hidden Unicode characters.
Learn more about bidirectional Unicode characters
mkdir -p /data/temperature_sensors /www3/temperature_sensors | |
#The graphs can be accessed: http://192.168.1.1/myadmin/temperature_sensors | |
ln -s /www3/temperature_sensors /www3/myadmin/temperature_sensors | |
#Create RRDtool database to store the values every 10 minutes (600 seconds) for 10 years (525600 * 600 seconds) | |
rrdtool create /data/temperature_sensors/temperature_sensors.rrd --step 600 \ | |
DS:temp0:GAUGE:1000:-273:5000 DS:temp1:GAUGE:1000:-273:5000 RRA:AVERAGE:0.5:1:525600 \ | |
RRA:MIN:0.5:1:525600 RRA:MAX:0.5:1:525600 | |
#Add cron entry to put the temperatures into the database | |
cat >> /etc/crontabs/root << \EOF | |
*/10 * * * * test -f /data/temperature_sensors/temperature_sensors.rrd && rrdtool update /data/temperature_sensors/temperature_sensors.rrd $(date +\%s):$(thermometer | tr -s \\n ' ' | awk '{print $2":"$4}') | |
EOF | |
#Create main graph script | |
cat > /data/temperature_sensors/temperature_sensors-graph.sh << \EOF | |
#!/bin/sh | |
NAME=$(echo $0 | sed 's@.*/\([^-]*\)-.*@\1@') | |
RRD_FILE="/data/$NAME/$NAME.rrd" | |
DST_FILE="/www3/$NAME/$1.png" | |
RRD_PARAMETERS=' | |
$DST_FILE --end=$(date +%s) --vertical-label "Temperature .C" --width 1024 --height 600 --lower-limit 0 | |
DEF:temp0=$RRD_FILE:temp0:AVERAGE | |
DEF:temp1=$RRD_FILE:temp1:AVERAGE | |
LINE1:temp0#CF00FF:"10 minutes average Board\\n" | |
LINE2:temp1#FF3C00:"10 minutes average CPU\\n" | |
COMMENT:" \\n" | |
GPRINT:temp0:MIN:"Minimum Board\\: %4.1lf .C " | |
GPRINT:temp1:MIN:"Minimum CPU\\: %4.1lf .C " | |
GPRINT:temp0:MAX:"Maximum Board\\: %4.1lf .C " | |
GPRINT:temp1:MAX:"Maximum CPU\\: %4.1lf .C\\n" | |
GPRINT:temp0:AVERAGE:"Average Board\\: %4.1lf .C " | |
GPRINT:temp1:AVERAGE:"Average CPU\\: %4.1lf .C " | |
GPRINT:temp0:LAST:"Current Board\\: %4.1lf .C " | |
GPRINT:temp1:LAST:"Current CPU\\: %4.1lf .C" | |
> /dev/null | |
' | |
case $1 in | |
daily) | |
eval /usr/bin/rrdtool graph --start="end-2days" --title \'Daily graph [`date +"%F %H:%M"`]\' $RRD_PARAMETERS | |
;; | |
weekly) | |
eval /usr/bin/rrdtool graph --start="end-2week" --title \'Weekly graph [`date +"%F %H:%M"`]\' $RRD_PARAMETERS | |
;; | |
monthly) | |
eval /usr/bin/rrdtool graph --start="end-2month" --title \'Monthly graph [`date +"%F %H:%M"`]\' $RRD_PARAMETERS | |
;; | |
yearly) | |
eval /usr/bin/rrdtool graph --start="end-1year" --title \'Yearly graph [`date +"%F %H:%M"`]\' $RRD_PARAMETERS | |
;; | |
2years) | |
eval /usr/bin/rrdtool graph --start="end-2years" --title \'2 Years graph [`date +"%F %H:%M"`]\' $RRD_PARAMETERS | |
;; | |
5years) | |
eval /usr/bin/rrdtool graph --start="end-5years" --title \'5 Years graph [`date +"%F %H:%M"`]\' $RRD_PARAMETERS | |
;; | |
10years) | |
eval /usr/bin/rrdtool graph --start="end-10years" --title \'10 Years graph [`date +"%F %H:%M"`]\' $RRD_PARAMETERS | |
;; | |
*) | |
echo "Please specify $0 [daily|weekly|monthly|yearly|2years|5years|10years]" | |
;; | |
esac | |
EOF | |
chmod a+x /data/temperature_sensors/temperature_sensors-graph.sh | |
#Add cron entry to generate graphs | |
cat >> /etc/crontabs/root << EOF | |
7 * * * * /data/temperature_sensors/temperature_sensors-graph.sh daily | |
1 1 * * * /data/temperature_sensors/temperature_sensors-graph.sh weekly | |
2 1 * * 0 /data/temperature_sensors/temperature_sensors-graph.sh monthly | |
3 1 1 * * /data/temperature_sensors/temperature_sensors-graph.sh yearly | |
4 1 1 1 * /data/temperature_sensors/temperature_sensors-graph.sh 2years | |
5 1 1 1 * /data/temperature_sensors/temperature_sensors-graph.sh 5years | |
6 1 1 1 * /data/temperature_sensors/temperature_sensors-graph.sh 10years | |
EOF |
You should be able to see the generated graphs in http://192.168.1.1/myadmin/temperature_sensors in few next days.
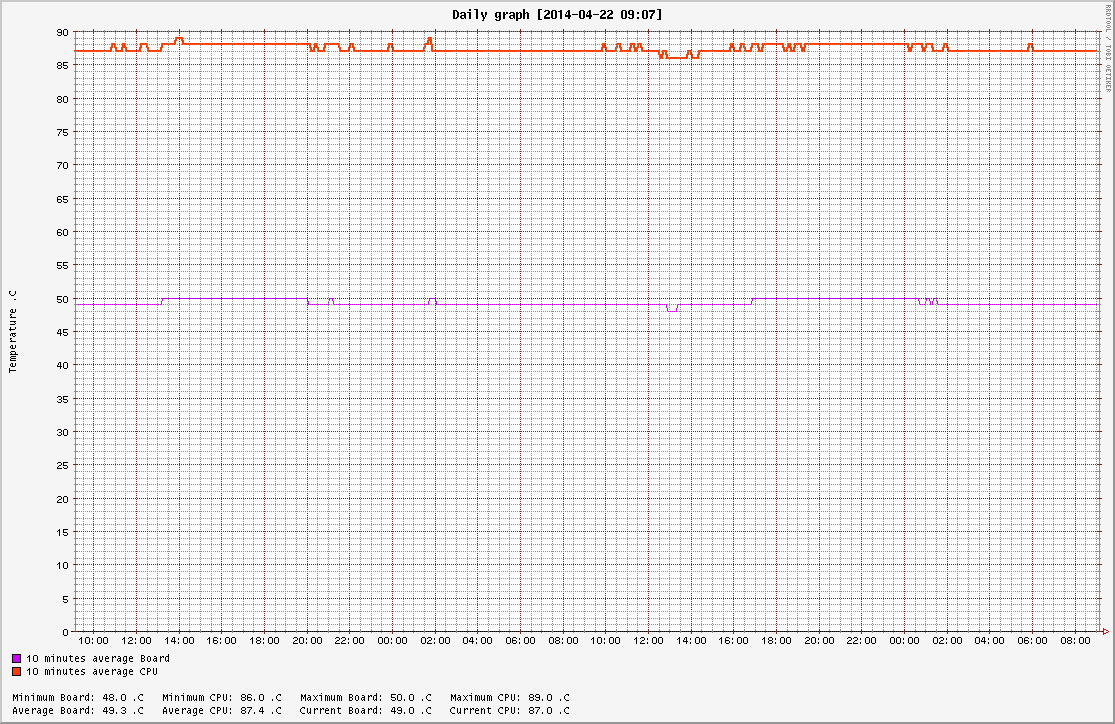
Here is the example:
External thermometers
I'm using two external thermometers to monitor temperature around router + in the room. These were build according the following descriptions:http://www.linuxfocus.org/English/November2003/article315.shtml
http://martybugs.net/electronics/tempsensor/hardware.cgi
I used the serial to usb converter and it's working nicely with Digitemp:
gate / # digitemp_DS9097 -c/etc/digitemp.conf -t0 -q -s/dev/ttyUSB0 -o"%.2C"
28.00
gate / # digitemp_DS9097 -c/etc/digitemp.conf -t1 -q -s/dev/ttyUSB0 -o"%.2C"
20.63
The scripts are very similar to previous solution, except getting the data from thermometers. It's happened form time to time, that digitemp returns bad values, so you need to read them few few times.
This file contains hidden or bidirectional Unicode text that may be interpreted or compiled differently than what appears below. To review, open the file in an editor that reveals hidden Unicode characters.
Learn more about bidirectional Unicode characters
mkdir -p /data/mydigitemp /www3/mydigitemp | |
#The graphs can be accessed: http://192.168.1.1/myadmin/mydigitemp | |
ln -s /www3/mydigitemp /www3/myadmin/mydigitemp | |
#Create RRDtool database to store the values every 10 minutes (600 seconds) for 10 years (525600 * 600 seconds) | |
rrdtool create /data/mydigitemp/mydigitemp.rrd --step 600 \ | |
DS:temp0:GAUGE:1000:-273:5000 DS:temp1:GAUGE:1000:-273:5000 RRA:AVERAGE:0.5:1:525600 \ | |
RRA:MIN:0.5:1:525600 RRA:MAX:0.5:1:525600 | |
#Script getting the data from termometers | |
cat > /data/mydigitemp/mydigitemp.sh << \EOF | |
#!/bin/sh | |
TEMP0_ROUNDED=1000 | |
TEMP1_ROUNDED=1000 | |
#Sometimes the values are not in the right "range" and needs to be read few times | |
while [ $TEMP0_ROUNDED -gt 50 ] || [ $TEMP0_ROUNDED -lt 5 ] ; do | |
TEMP0=$(/usr/bin/digitemp_DS9097 -c/etc/digitemp.conf -t0 -q -s/dev/ttyUSB0 -o"%.2C") | |
TEMP0_ROUNDED=`echo $TEMP0 | awk '{print int($1+0.5)}'` | |
done | |
while [ $TEMP1_ROUNDED -gt 50 ] || [ $TEMP1_ROUNDED -lt 5 ] ; do | |
TEMP1=$(/usr/bin/digitemp_DS9097 -c/etc/digitemp.conf -t1 -q -s/dev/ttyUSB0 -o"%.2C") | |
TEMP1_ROUNDED=`echo $TEMP1 | awk '{print int($1+0.5)}'` | |
done | |
/usr/bin/rrdtool update /data/mydigitemp/mydigitemp.rrd $(date +%s):$TEMP0:$TEMP1 | |
EOF | |
cat > /data/mydigitemp/mydigitemp-graph.sh << EOF | |
#!/bin/sh | |
RRD_FILE="/data/mydigitemp/mydigitemp.rrd" | |
DST_FILE="/www3/mydigitemp/$1.png" | |
RRD_PARAMETERS=' | |
$DST_FILE --end=$(date +%s) --vertical-label "Temperature .C" --width 1024 --height 600 --lower-limit 0 | |
DEF:temp0=$RRD_FILE:temp0:AVERAGE | |
DEF:temp1=$RRD_FILE:temp1:AVERAGE | |
LINE1:temp0#CF00FF:"10 minutes average inside\\n" | |
LINE2:temp1#FF3C00:"10 minutes average outside\\n" | |
COMMENT:" \\n" | |
GPRINT:temp0:MIN:"Minimum inside\\: %4.1lf .C " | |
GPRINT:temp1:MIN:"Minimum outside\\: %4.1lf .C " | |
GPRINT:temp0:MAX:"Maximum inside\\: %4.1lf .C " | |
GPRINT:temp1:MAX:"Maximum outside\\: %4.1lf .C\\n" | |
GPRINT:temp0:AVERAGE:"Average inside\\: %4.1lf .C " | |
GPRINT:temp1:AVERAGE:"Average outside\\: %4.1lf .C " | |
GPRINT:temp0:LAST:"Current inside\\: %4.1lf .C " | |
GPRINT:temp1:LAST:"Current outside\\: %4.1lf .C" | |
> /dev/null | |
' | |
case $1 in | |
daily) | |
eval /usr/bin/rrdtool graph --start="end-2days" --title \'Daily graph [`date +"%F %H:%M"`]\' $RRD_PARAMETERS | |
;; | |
weekly) | |
eval /usr/bin/rrdtool graph --start="end-2week" --title \'Weekly graph [`date +"%F %H:%M"`]\' $RRD_PARAMETERS | |
;; | |
monthly) | |
eval /usr/bin/rrdtool graph --start="end-2month" --title \'Monthly graph [`date +"%F %H:%M"`]\' $RRD_PARAMETERS | |
;; | |
yearly) | |
eval /usr/bin/rrdtool graph --start="end-1year" --title \'Yearly graph [`date +"%F %H:%M"`]\' $RRD_PARAMETERS | |
;; | |
2years) | |
eval /usr/bin/rrdtool graph --start="end-2years" --title \'2 Years graph [`date +"%F %H:%M"`]\' $RRD_PARAMETERS | |
;; | |
5years) | |
eval /usr/bin/rrdtool graph --start="end-5years" --title \'5 Years graph [`date +"%F %H:%M"`]\' $RRD_PARAMETERS | |
;; | |
10years) | |
eval /usr/bin/rrdtool graph --start="end-10years" --title \'10 Years graph [`date +"%F %H:%M"`]\' $RRD_PARAMETERS | |
;; | |
*) | |
echo "Please specify $0 [daily|weekly|monthly|yearly|2years|5years|10years]" | |
;; | |
esac | |
EOF | |
chmod a+x /data/mydigitemp/*.sh | |
#Add cron entries to put the temperatures into the database and create graphs | |
cat >> /etc/crontabs/root << \EOF | |
*/10 * * * * test -x /data/mydigitemp/mydigitemp.sh && /data/mydigitemp/mydigitemp.sh | |
0 * * * * /data/mydigitemp/mydigitemp-graph.sh daily | |
1 0 * * * /data/mydigitemp/mydigitemp-graph.sh weekly | |
2 0 * * 0 /data/mydigitemp/mydigitemp-graph.sh monthly | |
3 0 1 * * /data/mydigitemp/mydigitemp-graph.sh yearly | |
4 0 1 1 * /data/mydigitemp/mydigitemp-graph.sh 2years | |
5 0 1 1 * /data/mydigitemp/mydigitemp-graph.sh 5years | |
6 0 1 1 * /data/mydigitemp/mydigitemp-graph.sh 10years | |
EOF |
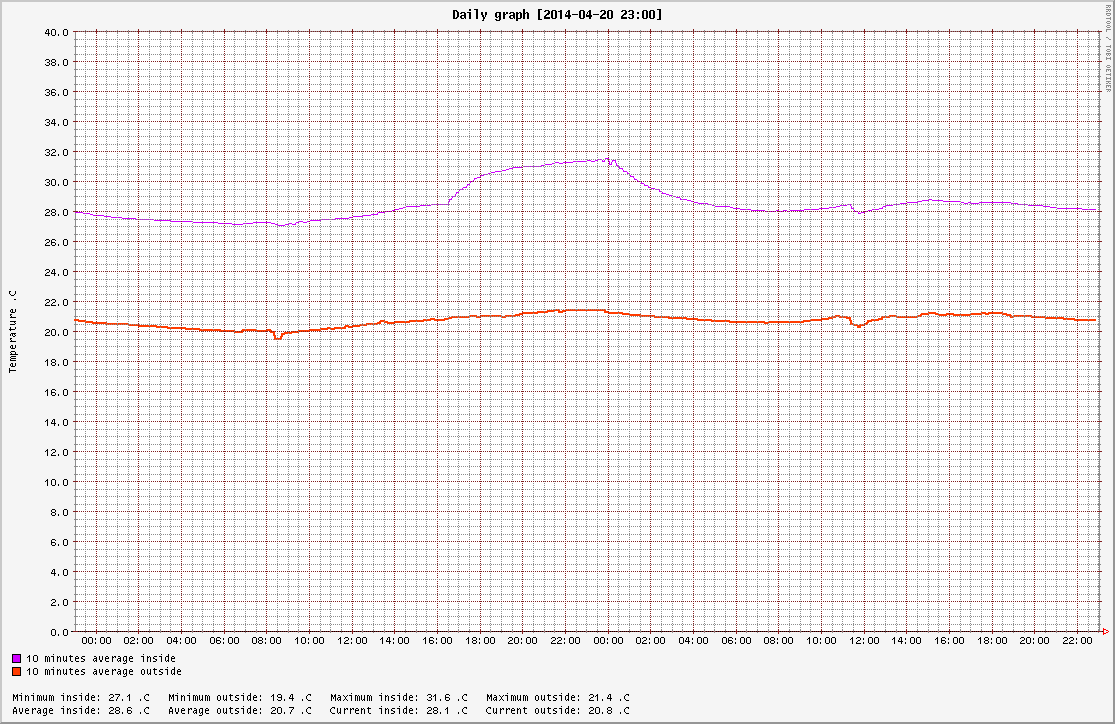
Graph example:
(you can see the temperature was higher when I turned the PC near the wifi router 16:00 and 00:00)
The scripts created by the steps above can be found in GitHub.
Enjoy...
This comment has been removed by the author.
ReplyDelete